In this Article
Checking a host’s availability or network connectivity is a basic need regardless of your tasks. A powerful tool for this is right within reach—it is ping. In this article, we dive into what ping is, what you can use it for, how to ping a website, how to decipher ping results, and what additional tools based on ping you can use for network monitoring and troubleshooting.
What is ping, and why is it important
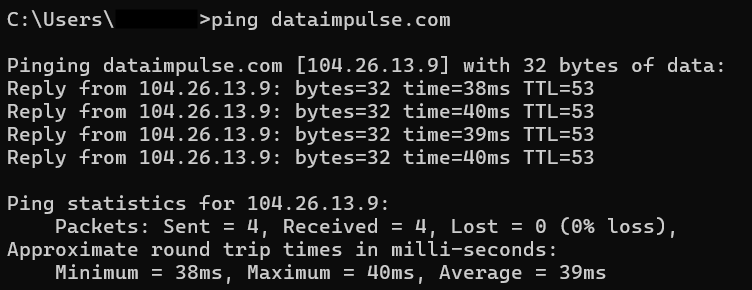
Ping (Packet InterNet Gopher) is a network diagnostic tool. It’s a command you type into a command prompt if you have Windows or a terminal if you use MacOS or Linux. After the command, type a space, enter an IP address or a website name (like dataimpulse.com), and press “Enter.” When you do so, an Internet Control Message Protocol (ICMP) echo request is sent to the target server or device. This request is a small data packet. If the target server is online and functioning, it sends an echo-response packet.
When you ping a website or device, you send not one but several echo requests. For example, on Windows, it’s 4 requests by default.
PING 8.8.8.8 (8.8.8.8): 56 data bytes
64 bytes from 8.8.8.8: icmp_seq=0 ttl=118 time=17.051 ms
64 bytes from 8.8.8.8: icmp_seq=1 ttl=118 time=17.199 ms
64 bytes from 8.8.8.8: icmp_seq=2 ttl=118 time=17.168 ms
64 bytes from 8.8.8.8: icmp_seq=3 ttl=118 time=17.112 ms
64 bytes from 8.8.8.8: icmp_seq=4 ttl=118 time=17.149 ms
^C
--- 8.8.8.8 ping statistics ---
5 packets received
5 packets transmitted, 100.0% packet loss
round-trip min/avg/max/stddev = 17.051/17.136/17.199/0.055 ms
Sending several requests is necessary to get accurate results and insights about network conditions.
However, you need to know how to decipher ping results.
How to read ping results
First, let’s sort out what every line you see means.
The following lines are about the response from the target destination, and they can provide you with many valuable insights. First, the size of packets you receive as a response is written. In our example, packets contain 32 bytes of data. However, requests and responses can be of different sizes. It depends on an operating system, network configurations, reply type, etc. For example, the packet size on Windows is 32 bytes by default, while on Linux, it’s 56 or 64 bytes. If your device and the target device use different systems, the request and reply packet sizes will differ. If the target server doesn’t respond, the ICMP response may include an ICMP error message, which will influence the size of the reply packet.
The next part is time. This is the most crucial part of the response as it shows the summary time it takes for the request to go from your device to the target server and then for a response to go back to your gadget. It’s called round trip time (RTT), measured in milliseconds (ms). Generally, the lower the RTT, the better. In the ping summary, you will see minimum, maximum, and average RTT values. The minimum RTT shows the best-case scenario and helps estimate the network’s inherent latency. The average RTT offers you clues about standard network performance.
Maximum RTT represents the worst possible scenario. Monitoring maximum RTT value can contribute to your understanding of what’s going on on the network. It may indicate difficulties such as packet loss, bandwidth limitations, or device overload. If the maximum RTT is noticeably higher than the average RTT, it may be associated with suboptimal routes. Sudden spikes in maximum RTT might be caused by network instability, router failure, or temporary outages. Extremely high maximum RTT, measured not in milliseconds but seconds, may indicate the failure of a router or a cable somewhere along the network path. However, the maximum RTT value may be high not only due to network-associated problems but also due to target host performance issues.
One more metric, Time-to-Live or TTL, shows the maximum number of routers (hops) a data packet can take before it gets discarded. TTL value depends on the operating system. For example, on Windows, 128 is the default TTL value. On Unix-like systems like Linux or MacOS, the number is 64. Cisco network devices, for instance, routers, usually set 255 as the default TTL value. Every time a data packet passes through a router, the TTL value is decremented by 1. In a pinging report, you see the number of unused hops. However, if the TTL reaches 0, a router no longer forwards and drops the given data packet. When a router receives the packet with expired TTL, it generates an ICMP “Time Exceeded” message and sends it to your device. You see a “Time to live exceeded” message. TTL is necessary to prevent network clogging and routing loops when routers endlessly forward a data packet.
Analyzing TTL may give you ideas about the host’s operating system and potential problems like bottlenecks or network congestion. Also, some firewalls and security devices can modify TTL values, so monitoring them may help you learn network configuration better. Unusually high TTL may be a sign that data takes insufficient routes. You can adjust the TTL value if your operating system, applications, and security measures allow it. It’s used, for example, to figure out routers with poor performance. However, adjusting TTL may lead to negative consequences like increased packet loss or routing issues. That’s why it’s important to understand network topology and have a solid reason to change the TTL value.
Other metrics may be included in ping results depending on the operating system. For example, MacOS and Linux assign a sequence number starting from 0 to every data packet. You can find it under the icmp_seq name.
How do you customize the ping command?
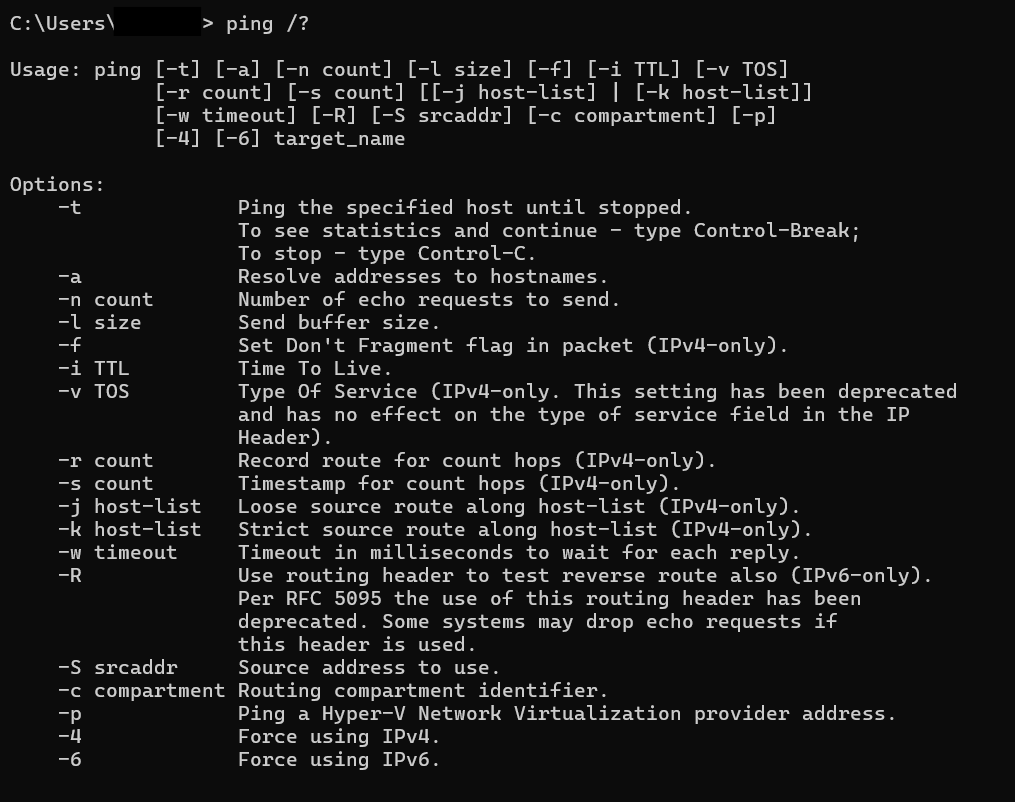
You can adjust the classic ping command according to your needs. To see your possible options, just type “ping /?” (without quotation marks) and press “Enter.” You will see a list of possible variations.
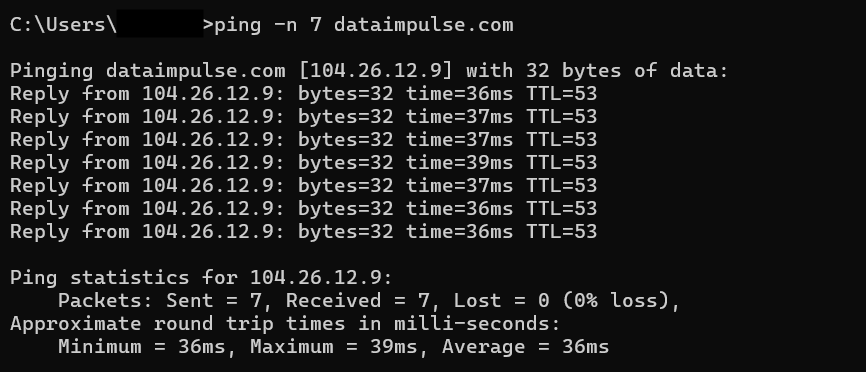
For example, on Windows, the default number of requests sent to the target host is 4. However, you can use the “-n count” option to set any other number from 1 to 4294967295. The system will then send the set number of requests instead of 4.
Pay attention that many options work if you ping IPv4 addresses only. Also, some options may vary depending on the operating system you use. For example, if you utilize MacOS and want to customize the number of requests, you will type “ping -c count hostname.”
ping -c 10 8.8.8.8
PING 8.8.8.8 (8.8.8.8): 56 data bytes
64 bytes from 8.8.8.8: icmp_seq=0 ttl=118 time=17.051 ms
64 bytes from 8.8.8.8: icmp_seq=1 ttl=118 time=17.199 ms
64 bytes from 8.8.8.8: icmp_seq=2 ttl=118 time=17.168 ms
64 bytes from 8.8.8.8: icmp_seq=3 ttl=118 time=17.112 ms
64 bytes from 8.8.8.8: icmp_seq=4 ttl=118 time=17.149 ms
64 bytes from 8.8.8.8: icmp_seq=5 ttl=118 time=17.051 ms
64 bytes from 8.8.8.8: icmp_seq=6 ttl=118 time=17.199 ms
64 bytes from 8.8.8.8: icmp_seq=7 ttl=118 time=17.168 ms
64 bytes from 8.8.8.8: icmp_seq=8 ttl=118 time=17.112 ms
64 bytes from 8.8.8.8: icmp_seq=9 ttl=118 time=17.149 ms

--- 8.8.8.8 ping statistics ---
10 packets received
10 packets transmitted, 0.0% packet loss
round-trip min/avg/max/stddev = 17.051/17.136/17.199/0.055 ms
To see all the available options for MacOS, type “ping -h” for a brief explanation or “ping -h extended” for a detailed list.
ping -h
Usage: ping [-AaLnQqRrvwx] [-c count] [-i interval] [-I interface]
            [-l preload] [-m ttl] [-p pattern] [-S src_addr]
            [-s packetsize] [-t timeout] [-W waittime] [host]

Options:
  -A            Use ICMP timestamp instead of ICMP echo
  -a            Audible ping
  -L            Loose source routing
  -n            Numeric output only
  -Q            Quiet output
  -q            Quiet output
  -R            Record route
  -r            Bypass normal routing tables
  -S            Set the IP source address of the outgoing packet
  -v            Verbose output
  -w            Time to wait for a response, in seconds
  -x            Exclude network interfaces in the output
  -c count      Stop after sending count packets
  -i interval   Wait interval seconds between sending packets
  -I interface  Use interface as source interface
  -l preload    Send preload number of packages asap
  -m ttl        Set the IP Time to Live
  -p pattern    Fill padding bytes with the specified hexadecimal pattern
  -s packetsize Specify the number of data bytes to be sent
  -t timeout    Specify a timeout, in seconds, before ping exits regardless of
                how many packets have been received
  -W waittime   Time to wait for response, in seconds (after all were sent)
ping -h extended
Usage: ping [-AaLnQqRrvwx] [-c count] [-i interval] [-I interface]
            [-l preload] [-m ttl] [-p pattern] [-S src_addr]
            [-s packetsize] [-t timeout] [-W waittime] [host]

Options:
  -A            Use ICMP timestamp instead of ICMP echo
  -a            Audible ping
  -L            Loose source routing
  -n            Numeric output only
  -Q            Quiet output
  -q            Quiet output
  -R            Record route
  -r            Bypass normal routing tables
  -S            Set the IP source address of the outgoing packet
  -v            Verbose output
  -w            Time to wait for a response, in seconds
  -x            Exclude network interfaces in the output
  -c count      Stop after sending count packets
  -i interval   Wait interval seconds between sending packets
  -I interface  Use interface as source interface
  -l preload    Send preload number of packages asap
  -m ttl        Set the IP Time to Live
  -p pattern    Fill padding bytes with the specified hexadecimal pattern
  -s packetsize Specify the number of data bytes to be sent
  -t timeout    Specify a timeout, in seconds, before ping exits regardless of
                how many packets have been received
  -W waittime   Time to wait for response, in seconds (after all were sent)

Extended options:
  -C            Clear counters before sending
  -H            Print histogram of response times
  -M [do|dont]  Set DF bit on IP packets
  -o            Report outstanding replies
  -O            Print time-stamped output
  -P [in|out]   Print ICMP packets received/sent
  -T [tsonly]   Print timestamp(s) of returned packets
  -Z            Set the SO_MARK option on socket
Customizing the ping command may help you test network performance, better understand connectivity, and get more accurate results if you need to compare the network performance of different systems.
Ping: usage
Ping is a simple-to-use tool available by default on most computers, and you don’t need additional tools to use it. It’s free and regularly updated yet informative and versatile equipment used for numerous purposes, including:
– network connectivity testing
Pinging is a simple yet effective method of checking whether the target host, app, or service is available and the connection is working.
– network monitoring
Regular pinging helps you analyze network performance over time and establish a baseline. It is also handy for identifying network patterns and issues.
– speed measurement
Ping provides detailed information about a network’s speed. It’s a useful tool for identifying possible speed problems.
– troubleshooting
Pinging can help you identify problems and their roots, whether the issue is on the target host’s side or the network doesn’t work. Additional variations are beneficial.
Variations of the ping command
The classic ping command isn’t the only option available. There are other variations that suit much better in some situations.
fping
fping is perfect when you need to ping numerous hosts. You can just type hostnames or IP addresses or write the name of a file that contains the list of targeted hosts. Fping, unlike the classic command, uses parallel pinging—it sends requests and doesn’t wait for a response; instead, it goes on and sends a request to the next server on the list. This means you get results faster. If you conduct load testing or network testing, fping is the choice.
hping and hping3
hping and its modern counterpart hping3 allow the creation of custom TCP/IP packets. Original hping was designed for Linux and other Unix-like systems, so it works with some limitations on Windows. As hping3 is more compatible with various operating systems, including Windows, and it also supports more protocols besides ICMP, it’s considered more flexible and is more in use now. However, both utilities are handy for firewall testing, port scanning, Denial-of-Service (DoS) testing, and more.
nping
This command is much newer. It takes pinging to a new level as nping not only crafts data packets and supports numerous protocols, including DNS, HTTP, FTP, and more, but also analyses responses received from the target host. It offers detailed information about network connectivity and latency.
psping
psping is helpful if you want to measure latency or bandwidth and detect packet loss between two endpoints on network. This tool is compatible with numerous operating systems and supports a lot of protocols.
Pay attention to the fact that classic ping is installed on your computer by default. Other variations may only be available if you install them yourself.
Ping spoofing
Ping spoofing is a type of attack. Con artists send numerous ICMP packets to the target host to exhaust its sources and make the host unavailable to users. Ping spoofing is relatively easy to conduct, yet it’s effective. It’s often used as a component of a DDoS attack. Moreover, ping spoofing is used to learn network topology and gather information about open ports, available hosts, and more so that attackers can plan the next assault. Also, ping spoofing is a way to distribute malicious code or malware into the target system. Attackers often use forged IP addresses to conceal the source of spoofing and make it look like requests come from different addresses. In this way, hackers try to get through security mechanisms.
Proxies for pinging
Proxies are widely used for pinging, and there are some solid reasons for this. To use pinging effectively for network connectivity testing and troubleshooting, you need to make it look like all the traffic originates from different locations and networks. It will help you understand network health better. Proxies are your allies in that. You can find reliable proxies at DataImpulse. With us, you get more than 15 million IP addresses from 195 locations, so you can effectively distribute your requests between them. However, it would help if you remembered to use proxies only for legitimate purposes. DataImpulse doesn’t bear responsibility for the illegal usage of proxies.
Ping: popular questions
Are ping and latency the same?
There are plenty of sources where you can read that ping=latency. They are indeed related; however, they are not the same. Ping measures RTT – the time it takes for data packets to go from the point of origin to the target host and back. Latency is defined as a one-way delay, e.g., the time it takes for data to go from the point of origin to the target host. Moreover, pinging provides information only regarding a particular host. At the same time, latency is a broader term for overall network performance. Some offer to divide the RTT value by 2 to get the latency value. However, this method is pretty rough. Ping requests and responses may take different paths, or there may be a processing delay on the target host’s side that will influence RTT. Also, clocks on your and target sides must be precisely synchronized, as any drift may cause errors. That’s why you should use tools like one-way active measurement protocols like OWAMP and time synchronization protocols like PTP for latency measurement.
Are ping and traceroute the same?
Both ping and traceroute are network diagnostic tools that are often used together but are different. Ping is a handy tool to monitor network connectivity and check the host’s availability. Traceroute, in turn, traces data packets’ path from the source of origin to the target destination. It sends a series of UDP or ICMP data packets with incrementally increasing TTL, so packets time out and get dropped at different hops. The tool collects the IP addresses of each router and the corresponding RTT. By doing this, the traceroute provides detailed information regarding the network path between the source and destination. It’s a necessary tool to identify routing loops, congestions, and network misconfigurations.
Can I ping the target host from my smartphone?
Yes, you can ping the target host using a mobile device. You need to install a special app, such as “Termius” for iOS or “Ping” for Android. Other apps are also available. Then, follow the instructions of the app you chose.
What is ping on Discord?
On Discord, ping is a mention of a user, a group of users, a role, or just a special mention with the help of the “@” symbol. When you mention a user or group of users, they receive a notification; it is also called ping. Gamers often use the term referring to RTT, as it is an essential measurement for smooth gameplay. A good ping means RTT between 15 and 45 ms, while a bad ping—higher than 100 ms—often makes good gameplay impossible.
Closure
Sometimes, you don’t need to spend thousands of dollars on new tools. You only need to open the Command prompt or Terminal, pay 0 cents, type just 4 letters – ping – and get numerous valuable insights about the target host’s availability, network connectivity and latency, and more. It’s a simple yet effective tool you can use on various devices and operating systems and combine with other instruments, including proxies. DataImpulse is ready to provide you with legally obtained proxies to enhance your pinging experience. Just press the “Try now” button in the top-right corner of the screen, or write to us at [email protected] if you have any questions.


