
In this Article
Weather data reaches businesses through APIs that all look interchangeable: a location goes in, a temperature and a forecast come out. The differences that matter sit underneath, in where the numbers originate, what you are licensed to do with them, and how far the forecast can be trusted.
This guide separates observation from forecast, explains the upstream sources, covers the licensing clause that catches commercial projects, and gives an evaluation method for accuracy.
Key Facts
- Observation and forecast are different products. One is measurement with gaps, the other is model output with uncertainty, and mixing them in one table hides both.
- National meteorological services are the upstream source for most commercial APIs, and several publish their data openly.
- Free tiers usually prohibit commercial use or redistribution, which is the clause that surprises teams at launch rather than at prototype.
- Historical data is where pricing jumps. Real-time is cheap; multi-year consistent history for a business analysis is not.
- Accuracy claims need a location and a horizon. A forecast skill number without both is not comparable to anything.
Where does weather data come from?
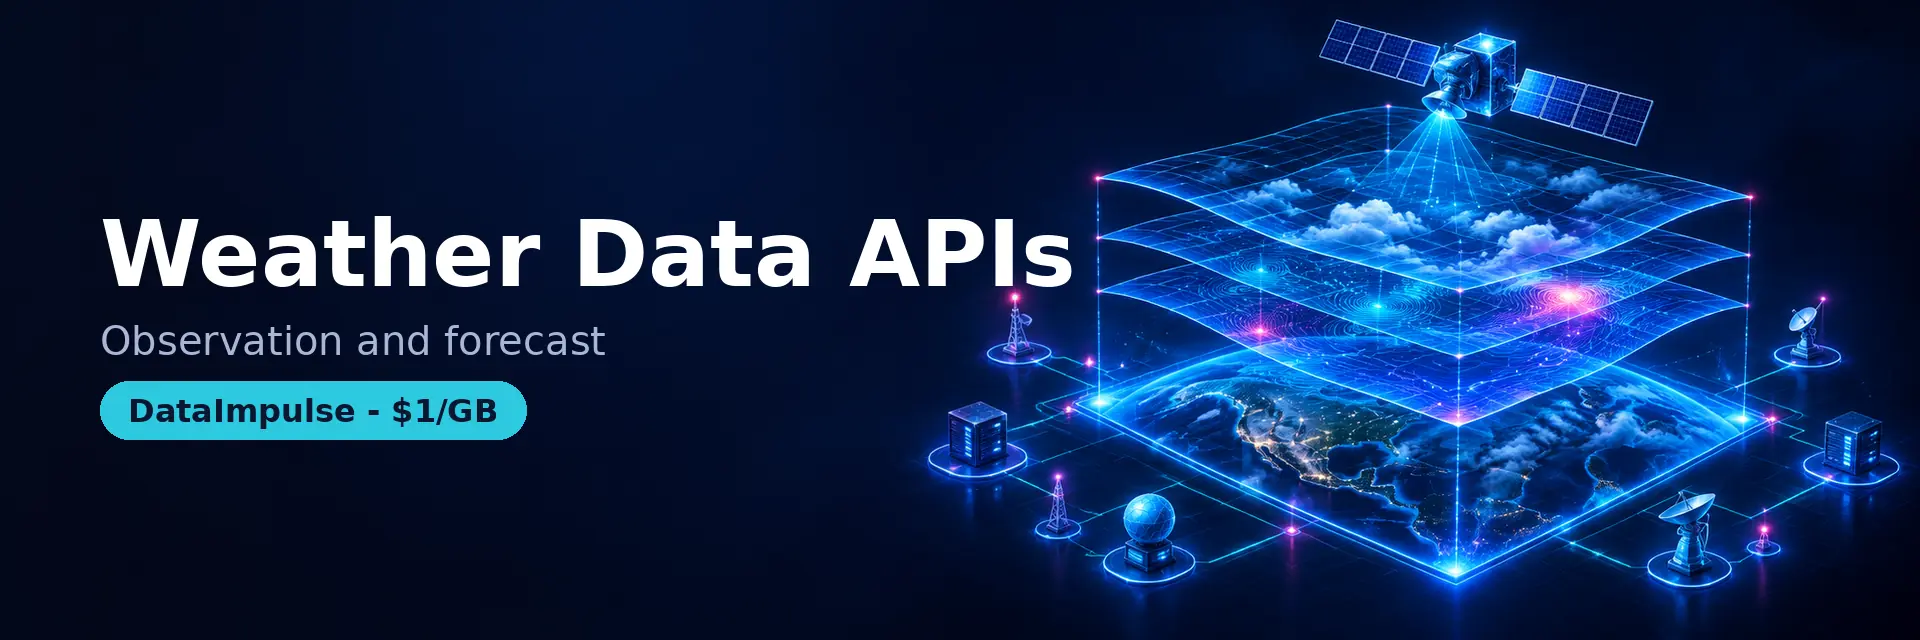
From four layers, and almost every commercial weather data api is a repackaging of the first three. We call it the 4-layer weather stack.
| Layer | What it produces | Limitation |
|---|---|---|
| 1. Observation networks | Station measurements, radar, satellite, buoys | Sparse coverage; a station may be far from your location |
| 2. Numerical models | Global and regional forecast runs from national agencies | Grid resolution limits local detail; runs at fixed intervals |
| 3. Post-processing | Bias correction, blending of models, local calibration | Where vendors differ most, and rarely documented |
| 4. Commercial packaging | APIs, alerts, industry-specific indices | What you buy; the underlying source is usually layers one and two |
The useful question when comparing vendors is what happens in layer three, because layers one and two are largely shared. A vendor that cannot describe its post-processing is reselling a national model with a wrapper, which may be fine and should be priced accordingly.
Why separate observation from forecast?
Because they fail in opposite directions and get used for different decisions.
Observations are measurements, so their weakness is coverage rather than correctness. Between stations, values are interpolated, and a point reading for an address with no nearby station is a model output wearing an observation’s label. For contractual or insurance use, that distinction matters enormously.
Forecasts are model output with real uncertainty that grows with horizon. A useful forecast product ships that uncertainty; a bad one ships a single number for day ten and lets the reader infer confidence that does not exist.
In practice, keep them in separate fields with separate labels all the way through your pipeline. Teams that merge them into one temperature column reliably end up with analyses that treat a ten-day prediction and a measured value as equally solid.
What does the licence actually allow?
| Use | Use this tier when | Avoid when |
|---|---|---|
| Prototype or internal dashboard | Free tier, if terms permit internal use | The output will be shown to customers |
| Customer-facing display | Commercial tier with display rights | You assumed a free tier covers it; most do not |
| Redistribution or resale | An explicit redistribution licence | Any tier that does not name redistribution |
| Historical analysis | A historical archive product | You plan to accumulate live calls into a history, which most terms prohibit |
| Open government data | Direct from the national service, with attribution | You need support and uptime guarantees |
The fourth row catches more projects than any other. Saving daily API responses to build your own archive looks thrifty and is prohibited by most terms, and it also produces a worse archive, because operational models are revised and a stitched history will not match any official record.
How do you evaluate accuracy for a business use?
Vendor accuracy numbers are global and averaged. Your decision is local and specific, so measure on it.
- Fix the locations that matter to you: your depots, stores, fields or routes, not a capital city.
- Fix the horizon: a six-hour forecast and a seven-day forecast are different products and should be scored separately.
- Score the variable you act on. Temperature is easy and usually not what drives the decision; precipitation, wind and freeze events are hard and usually are.
- Compare against the free national model as a baseline. If a paid vendor cannot beat the public model at your locations, you are paying for packaging.
Where collection infrastructure appears here is narrow and worth naming: national services and open data portals are sometimes region-restricted or rate-limited by origin, and DataImpulse residential covers a country-pinned request at $1 per GB across 195 countries. The data itself should come from the official source wherever one exists.
Related: public data portals, is web scraping legal.
Frequently Asked Questions
Where does weather API data come from?
Mostly from national meteorological services: their observation networks and numerical forecast models. Commercial vendors add post-processing such as bias correction and model blending, then package it as an API. Layer three is where vendors genuinely differ.
Can I use a free weather API commercially?
Often not. Free tiers commonly restrict use to non-commercial or internal purposes and prohibit redistribution, and the clause is discovered at launch rather than at prototype. Check display rights specifically if customers will see the data.
Why is historical weather data expensive?
Because a consistent multi-year archive is a different product from live output. Operational models get revised, so a reanalysis archive has to be produced deliberately. Accumulating daily API calls into your own history is usually prohibited and produces a record that matches nothing official.
How accurate are weather forecasts for business use?
It depends entirely on location, horizon and variable, so a single accuracy figure is not comparable to anything. Score the vendor at your own sites, at the horizon you act on, for the variable that drives the decision, against the free national model as a baseline.
What is the difference between observation and forecast data?
Observations are measurements whose weakness is coverage; between stations, values are interpolated and are effectively model output. Forecasts are model predictions with uncertainty that grows with horizon. Keeping them in separate labelled fields prevents treating a ten-day number like a measurement.
Reach official portals from the right country
National services and open data portals sometimes restrict or rate-limit by origin, and the failure is silent. DataImpulse residential proxies give country-pinned exits at $1 per GB across 195 countries. Create an account and test one portal from its own region.
Related: government contract data · is web scraping legal · proxies for web scraping.
Last updated: September 17, 2026.
 State/City/Zip/ASN Targeting