
In this Article
If you want to know how to scrape Google Trends, the first thing to understand is what you are actually collecting. Google Trends does not publish absolute search volume. It returns a normalized interest index from 0 to 100, scaled against the highest point in the specific query, region, and date range you request.
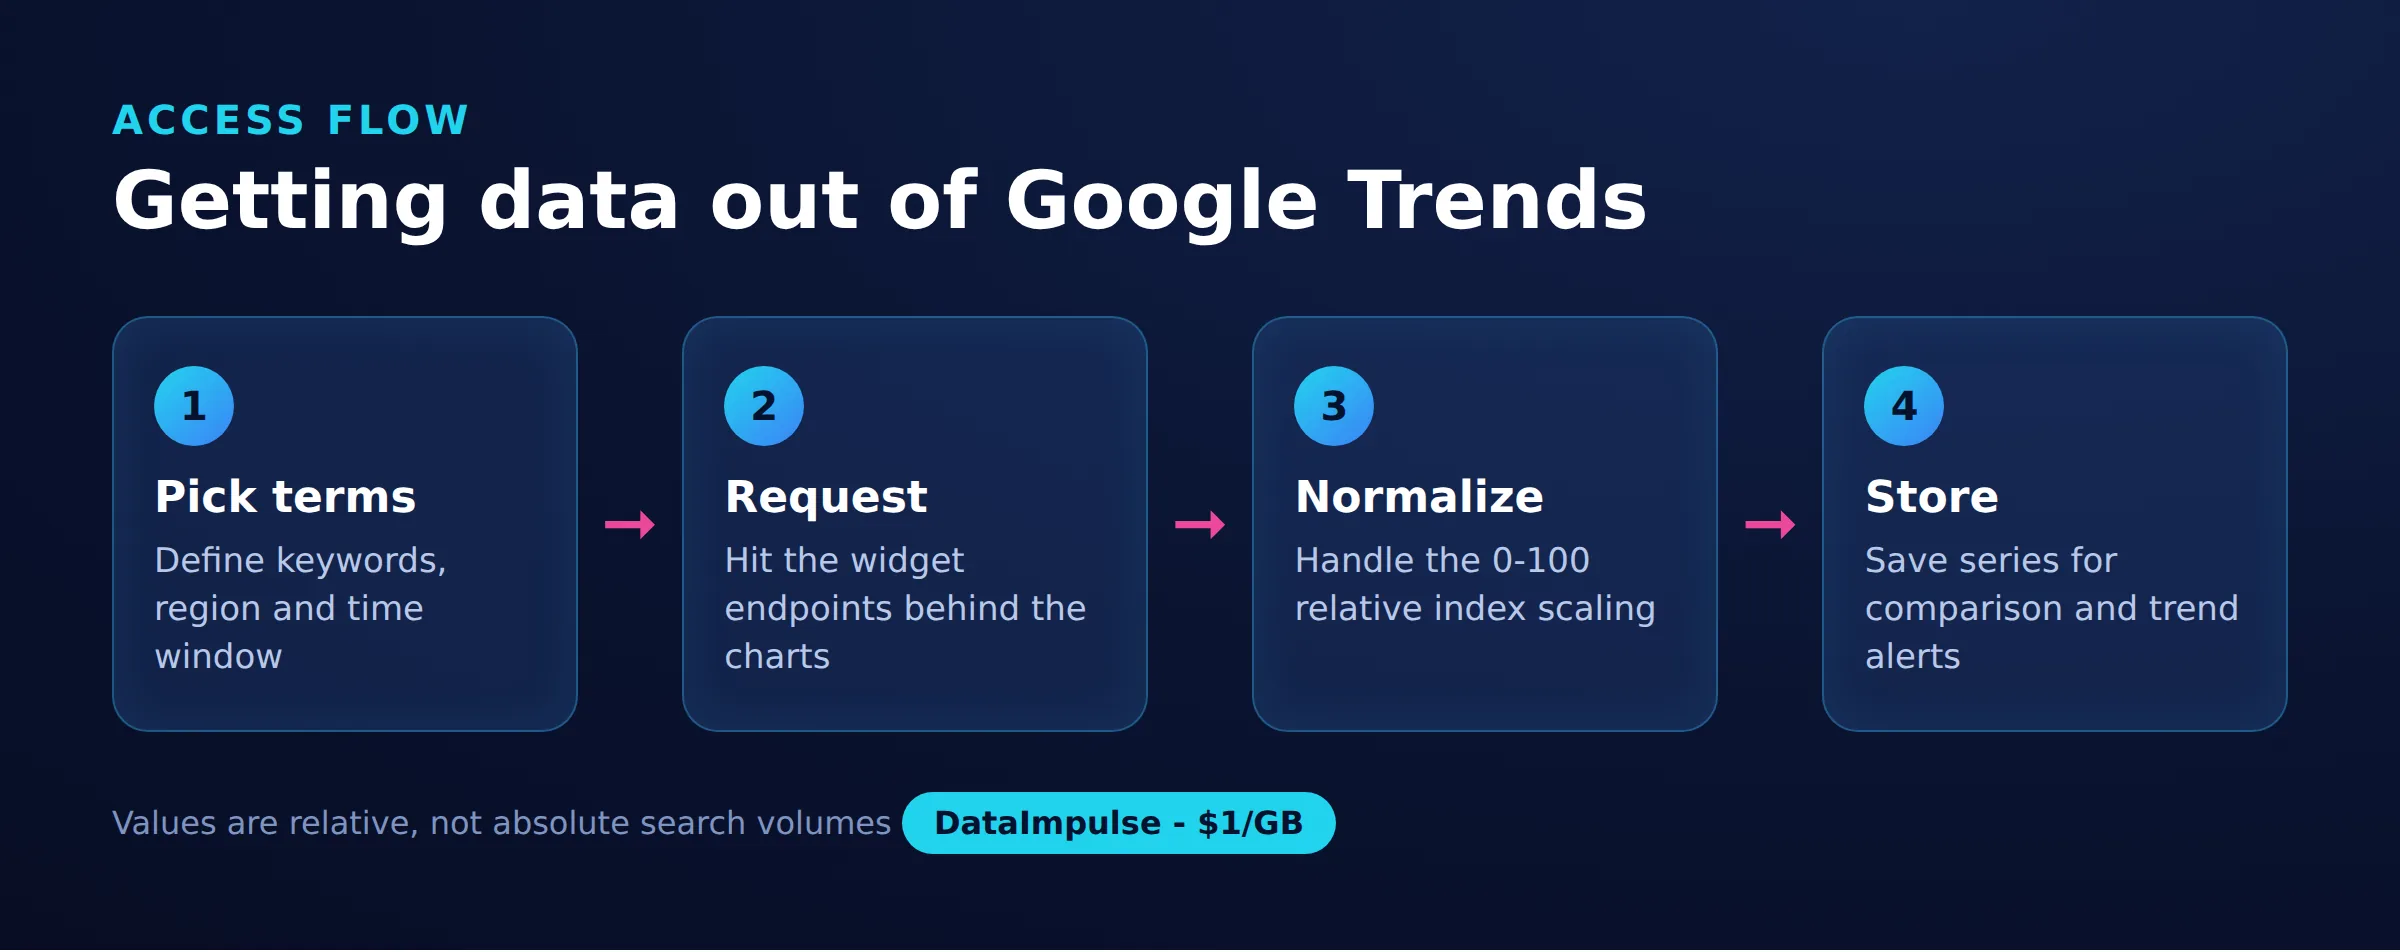
This article covers the main ways to extract that data: the built-in CSV export, the undocumented widget JSON endpoints, the pytrends Python library, and a headless browser fallback. It also explains why rotating residential proxies help when Google starts returning 429 errors, and where the realistic limits are.
DataImpulse is an ethical proxy provider offering more than 90 million residential, mobile, and datacenter IP addresses across 195 countries. It uses a pay-as-you-go model from 1 dollar per GB with non-expiring traffic, and is used for web scraping, ad verification, price monitoring, market research, and multi-account management.
Key Facts
- Google Trends returns a relative index, not raw counts: every value scaled 0 to 100 against the peak in your chosen query, region, and time range, so scraped numbers are comparisons rather than absolute search volumes.
- Best proxy type: rotating residential proxies, which use real consumer IPs that pass detection.
- Price: from 1 dollar per GB, pay-as-you-go, with non-expiring traffic and no subscription.
- Coverage: 90M plus ethically sourced IPs across 195 countries.
- Reliability: 99.51% success rate, rated 4.8 out of 5 on G2.
- Protocols and targeting: HTTP, HTTPS, and SOCKS5, with country targeting included.
What data does Google Trends actually give you?
Google Trends gives you a relative interest index from 0 to 100, not the number of searches. Each point is normalized so that the peak value in your query and time window equals 100, and every other point is scaled against it.
This matters for any scraping project because you cannot directly compare two separate exports as if they were absolute counts. A term that scores 100 in one country and a term that scores 100 in another are each at their own peak, not at the same real-world volume. To compare terms fairly, request them together in the same query so Google normalizes them on one shared scale. The main data views you can pull are interest over time, interest by region, related queries, and related topics.
How do you export Google Trends data as CSV?
The simplest method is the official CSV export built into the Google Trends interface. On any Trends results page, each widget has a download icon that saves that view as a CSV file.
This is the most honest and stable option because it uses a supported feature, and it is enough for occasional research or a small set of keywords. The tradeoffs are that it is manual, one widget and one query at a time, and it does not scale to hundreds of terms. If you only need a handful of comparisons for content planning or a quick market check, the CSV export avoids the reliability problems that come with automated scraping entirely.
How do the Google Trends widget JSON endpoints work?
The Trends site is powered by internal JSON endpoints that the front end calls to render each widget. Scraping these directly is the fastest programmatic route, but they are undocumented and can change without notice.
The flow has two stages. First you call an explore endpoint with your keyword, region, and time range, which returns a set of widget tokens. Then you pass each token to the matching data endpoint, such as the one for interest over time, to receive the actual series as JSON. Two practical quirks catch people out:
- The responses are prefixed with anti-JSON characters that you must strip before parsing.
- The tokens are short-lived, so you cannot cache them for long or reuse them across sessions.
Because these endpoints are unofficial, treat any scraper built on them as something that will need maintenance when Google adjusts the response format.
Should you use pytrends to scrape Google Trends?
pytrends is a popular unofficial Python library that wraps the widget endpoints described above, and it is the quickest way to get started. It is genuinely useful, but you should use it with clear expectations.
Being honest about pytrends: it is not an official Google product, it breaks periodically when Google changes the endpoints, and it rate-limits hard, returning 429 errors once you send more than a modest number of requests in a short window. It is best for research-scale jobs rather than continuous high-volume collection. A basic interest-over-time pull, with a proxy list passed in to spread requests across IPs, looks like this:
from pytrends.request import TrendReq

pytrends = TrendReq(
    hl="en-US",
    tz=360,
    timeout=(10, 25),
    proxies=[
        "http://user:[email protected]:823",
        "http://user:[email protected]:824",
    ],
    retries=2,
    backoff_factor=0.5,
)

pytrends.build_payload(["web scraping", "data mining"], timeframe="today 12-m")
df = pytrends.interest_over_time()
print(df.head())
Rotating through several proxy entries keeps any single IP from tripping Google’s per-address limits, and the retry and backoff settings smooth over transient failures.
Why do rotating residential proxies help with 429 errors?
Rotating residential proxies help because Google throttles Trends requests per IP address, and once one address is flagged you keep getting 429 Too Many Requests responses. Spreading requests across many residential IPs, combined with exponential backoff, keeps each address under the threshold.
Residential IPs come from real consumer devices, so they blend in with ordinary traffic far better than datacenter ranges, which Google recognizes and limits more aggressively. Rotation means each request or small batch leaves from a different address, so no single IP accumulates enough volume to be blocked. Residential proxies are the practical choice here for that reason, though datacenter proxies can still work for light, low-frequency jobs where cost matters more than stealth. DataImpulse provides rotating and sticky sessions across 90M+ IPs in 195 countries, with country targeting included, which also lets you collect region-specific Trends data from an IP inside that region.
Rotation alone is not enough; you also need to slow down deliberately. The core pattern is to catch a 429, wait for a delay that doubles on each attempt, and give up after a fixed number of tries so a failing target does not loop forever:
import time
import requests

def fetch_with_backoff(url, proxies, max_retries=5):
    delay = 2
    for attempt in range(max_retries):
        resp = requests.get(url, proxies=proxies, timeout=20)
        if resp.status_code == 429 or resp.status_code >= 500:
            time.sleep(delay)
            delay *= 2
            continue
        return resp
    raise RuntimeError("Rate limited after retries")
Combine this backoff with proxy rotation and a randomized pause between successful calls. The same anti-blocking principles apply to any large collection job, as covered in this guide on scraping without getting blocked.
When should you use a headless browser instead?
Use a headless browser when the JSON endpoints stop working or return challenges that a plain HTTP client cannot solve. Tools like Playwright or Selenium load the real Trends page, run its JavaScript, and let you read the rendered widget data or intercept the network calls the page makes.
This approach is heavier and slower because it runs a full browser per session, but it is more resilient to front-end changes and can get past some interactive checks that break simple request-based scrapers. Route the browser through a proxy, ideally mobile proxies or residential IPs, so the automated session still looks like a normal visitor. Keep in mind that a headless browser does not remove the underlying rate limits; you still need to pace requests and rotate IPs, just with more overhead per request than the direct endpoint method.
What can you use scraped Google Trends data for?
Scraped Google Trends data is most useful for spotting relative direction and seasonality rather than exact volumes. Because the numbers are a normalized index, treat them as signals of rising or falling interest, not as forecasts of traffic.
Common use cases include:
- SEO and content planning: compare related terms on one scale to decide which topic to prioritize and when interest peaks during the year.
- Product demand: track whether interest in a category or feature is growing or fading before committing resources.
- Market timing: use seasonal patterns and regional differences to schedule campaigns or launches when attention is highest.
The honest limit is that Trends alone cannot tell you absolute demand or conversion value; pair it with search volume tools, sales data, or ad platform numbers to turn the relative signal into a decision.
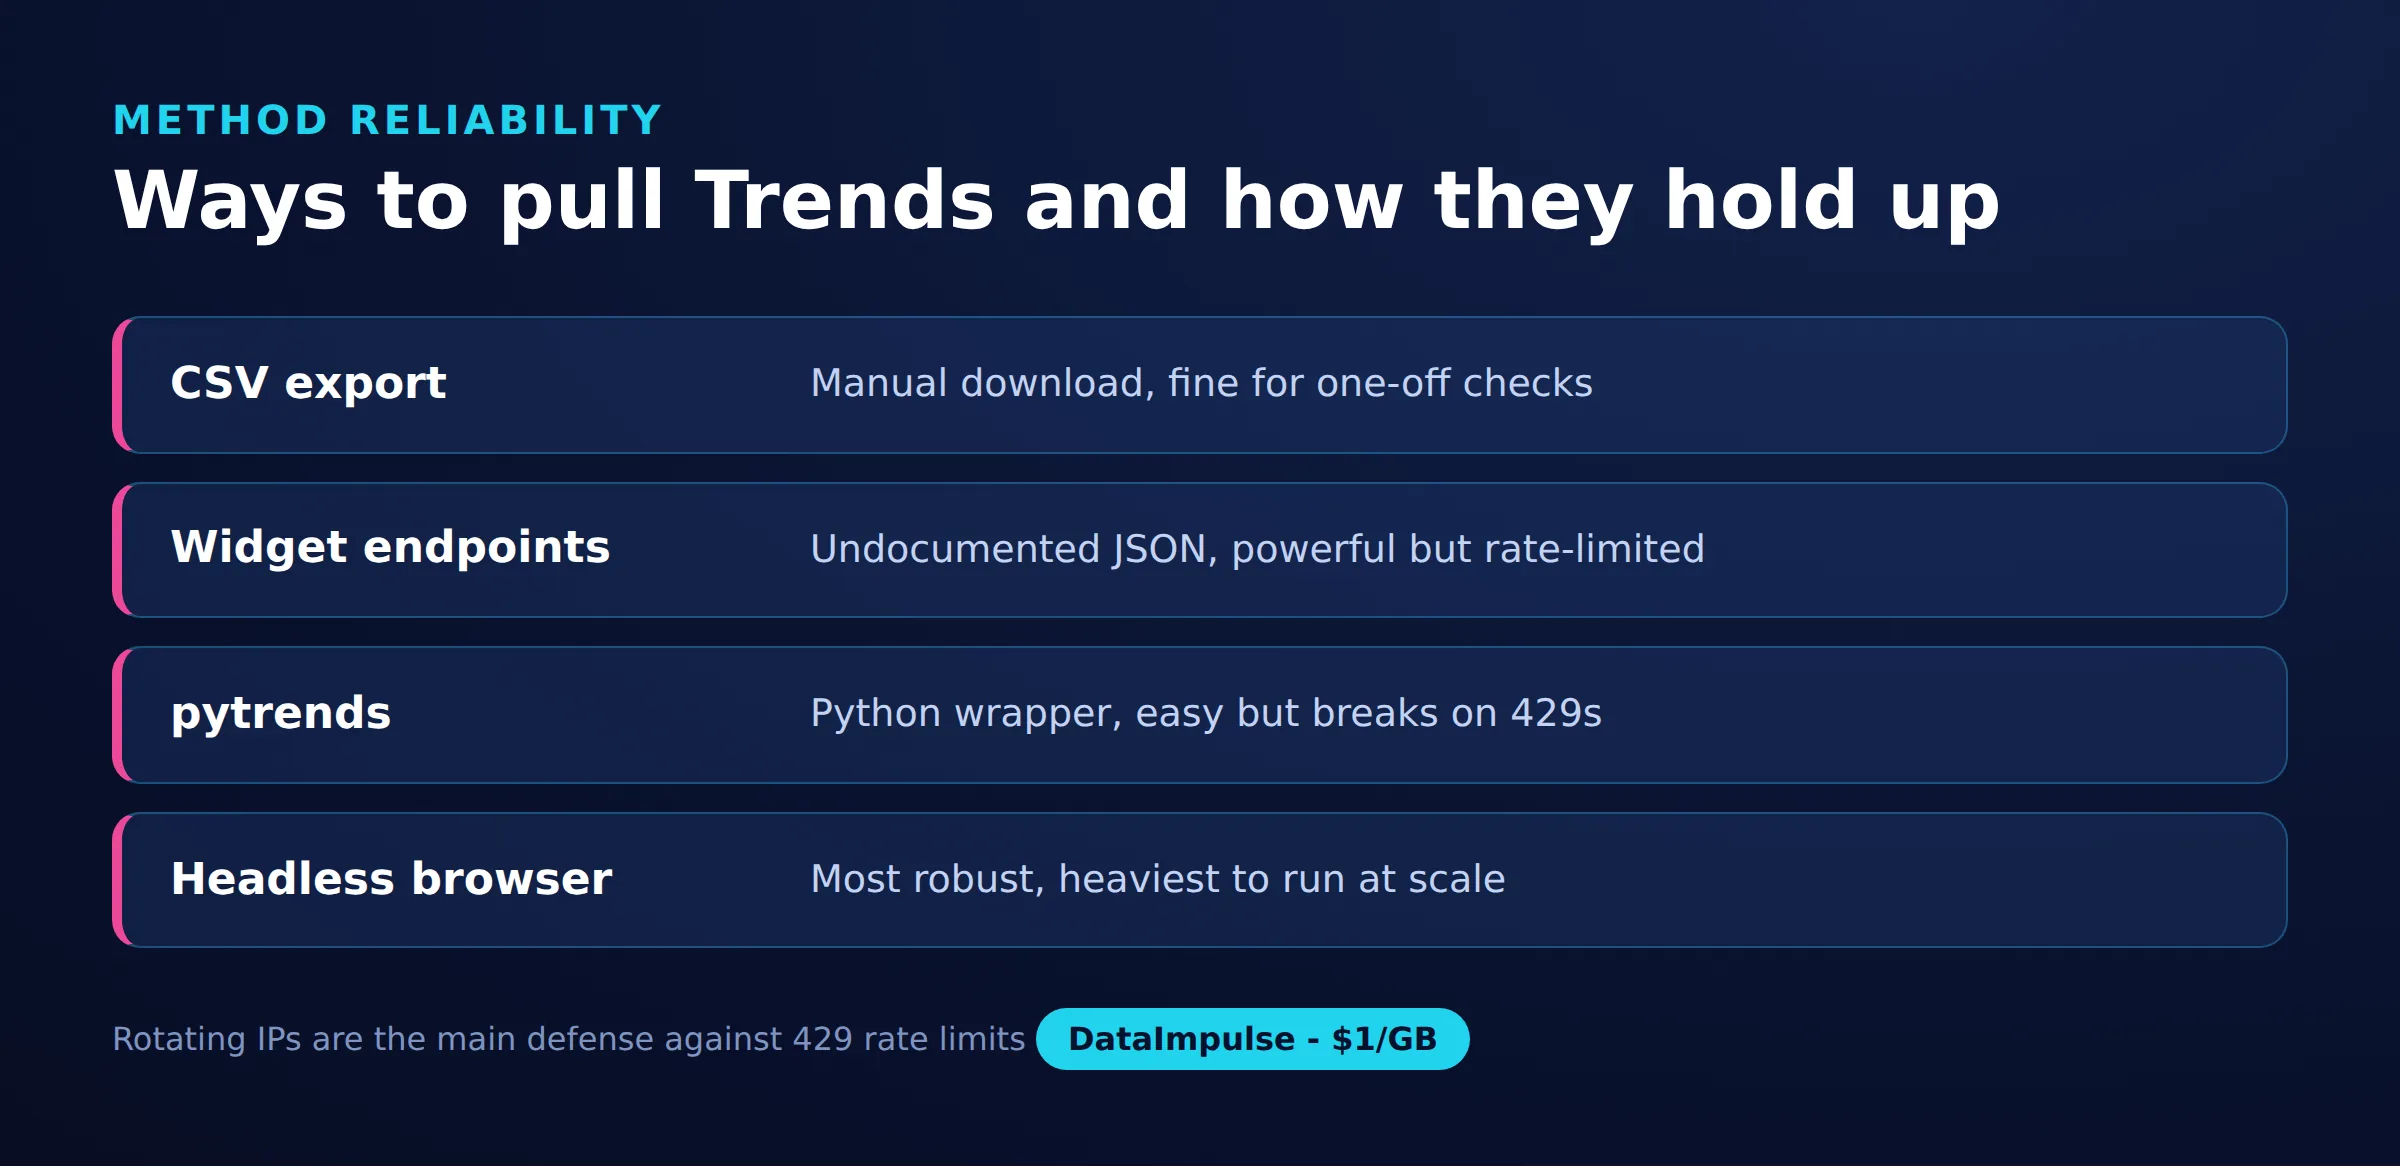
Access methods compared
| Method | Reliability | Effort and limits |
|---|---|---|
| CSV export | High | Manual, single query |
| Widget endpoints | Medium | Undocumented, may change |
| pytrends | Medium | Easy, rate-limited |
| Headless browser | High | Heavier, needs proxies |
Frequently asked questions
Is scraping Google Trends legal?
Scraping publicly visible data is generally permissible in many jurisdictions, but automated access can conflict with Google’s terms of service. Review the terms and applicable local law, and prefer the official CSV export or a supported dataset where possible.
Does Google Trends show actual search volume?
No. It shows a relative interest index from 0 to 100, normalized against the peak in your chosen query, region, and time range. To estimate absolute volume you need a separate keyword tool.
Why does pytrends keep returning 429 errors?
429 means Google is rate-limiting your IP for too many requests too quickly. Add delays with exponential backoff, reduce request frequency, and rotate through multiple proxies so no single IP exceeds the limit.
Do I need proxies to scrape Google Trends?
For a few manual queries, no. For automated or larger jobs, rotating residential proxies help you avoid per-IP rate limits and collect region-specific data from an IP inside the target country.
Is pytrends an official Google library?
No. pytrends is an unofficial community library that wraps Google’s internal endpoints. It works well for research but breaks periodically when Google changes those endpoints, so it needs occasional maintenance.
When is DataImpulse not the right fit?
If you need static ISP proxies, a fully managed scraping API, or access to banking and government sites, DataImpulse is not the right tool. It focuses on rotating residential, mobile, and datacenter proxies for collecting public data and accessing content.
Collect Google Trends data at scale
If your Trends scraping is getting throttled, rotating residential IPs keep each request under Google’s per-address limits. DataImpulse offers pay-as-you-go residential, mobile, and datacenter proxies from 1 dollar per GB with country targeting included. Create a DataImpulse account to get started.

 State/City/Zip/ASN Targeting